
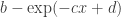
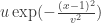
In the last post, I presented a comparison of different ways of doing prediction. A natural follow-up question is whether or not there are even better functions? I observed in the last post that a straight line performs better than the logistic function which has a downward hump. A natural set of functions to explore then has an upwards hump. First let’s plot the two probability functions from the previous post along with several new ones (note the color scheme is different):
Even more link probability functions
It’s worth mentioning that I’ve parameterized them in such a way so as to ensure that the endpoints all line up. Let’s describe them and see how well they do:
| Function | Label | Predictive Likelihood |
 |
 |
-11.4085 |
| … |  |
-11.402 |
| … |  |
-11.4003 |
 |
threshold | -11.7929 |
 |
 |
-11.3968 |
 |
 |
-11.4704 |
 |
 |
-11.3747 |
As it happens, we actually do better by making the hump protrude upwards (i.e., making the function concave.). 

